Grains & Cereal
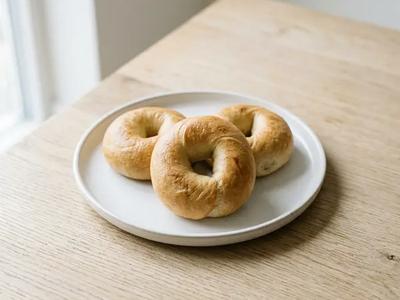
With bread, how much carbohydrate reaches your plate depends on the piece: a slice of bread weighs 25 to 32 g, a bagel about 100 g, a large wrap 72 g and a rice cake 9 g. So two foods with the same figure per 100 g can put very different amounts of carbohydrate on the plate. The Grains & Cereal guide compares loaves per 100 g; this guide counts the way you eat, by the piece. It covers the 53 breads, flatbreads, crackers and bakes in this category: what wholemeal, brown and multigrain legally mean, what the evidence on sourdough and rye says, where the fat sits in pastries, and why bread is a main source of salt. None of these foods carries a pregnancy caution.
See what works for you. Try SugarCurve free for 7 days
53 foodsLast reviewed: August 30, 2026Sources


No foods found for your search.
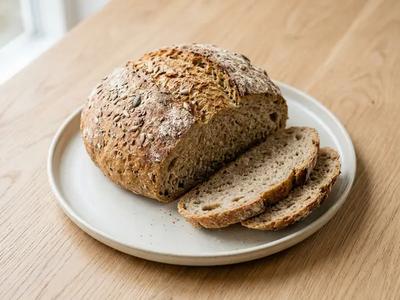
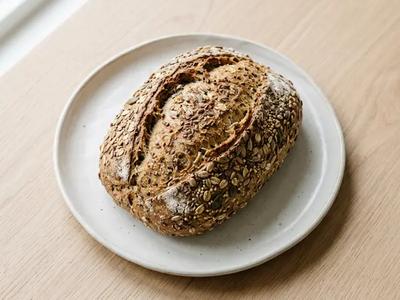
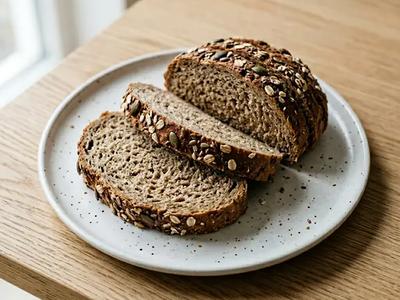
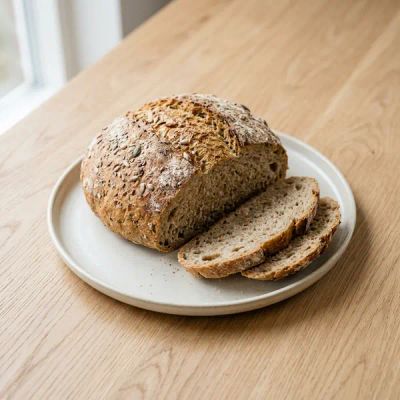
8 g of fibre per 100 g, the most of any loaf here, at 120 mg of sodium.
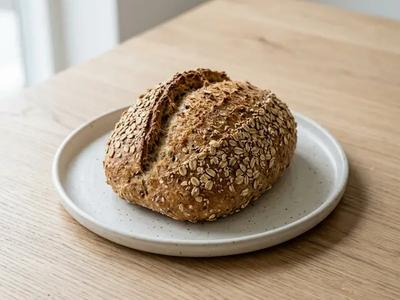
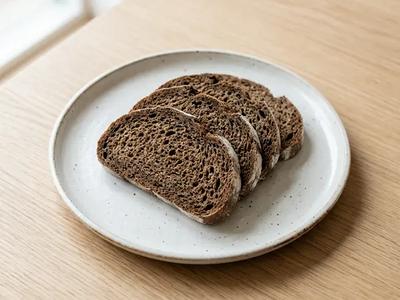
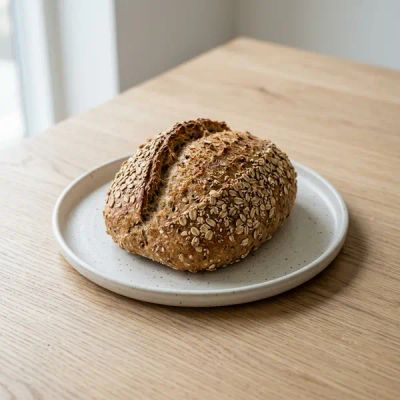
7.2 g of fibre per 100 g; check the salt, at 450 mg of sodium.
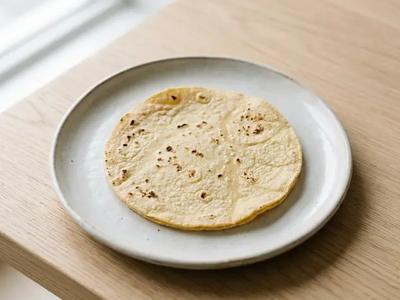
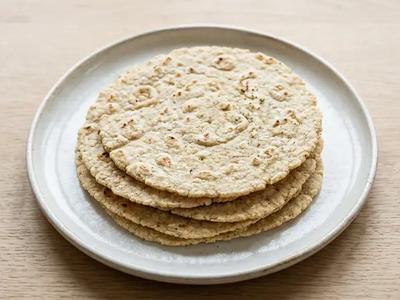
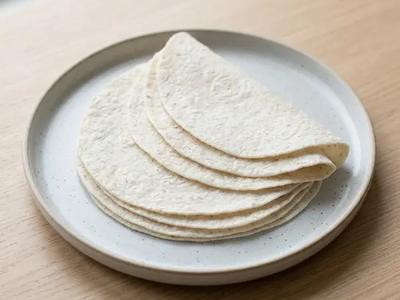
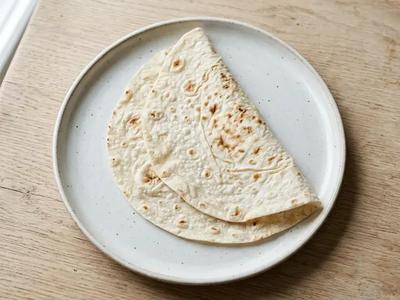
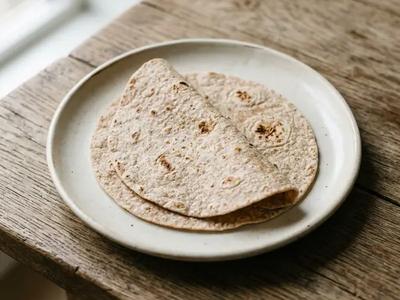
45 g of carbohydrate per 100 g, but a 6-inch tortilla weighs 26 g: about 12 g each.

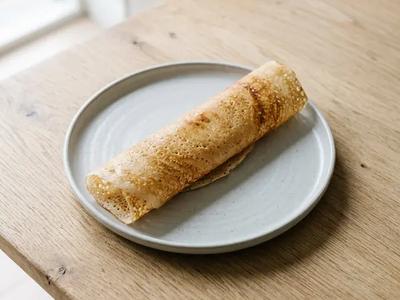
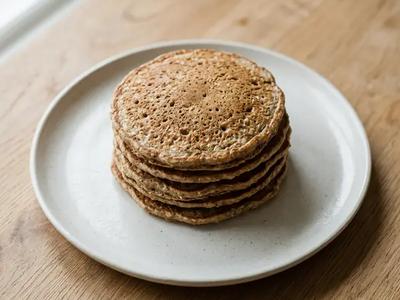
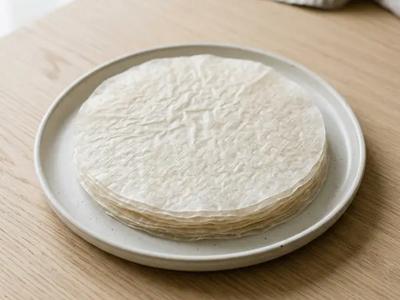
Listed wet: 20 g of carbohydrate per 100 g, the lowest of the flatbreads.
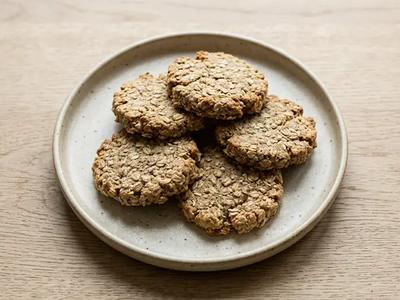
9.2 g of fibre per 100 g; the 550 mg of sodium is the figure to check.
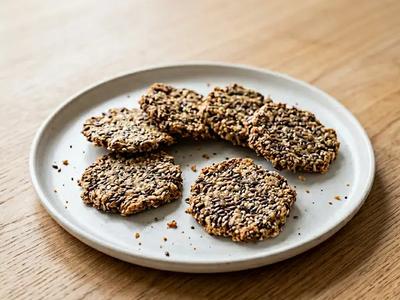
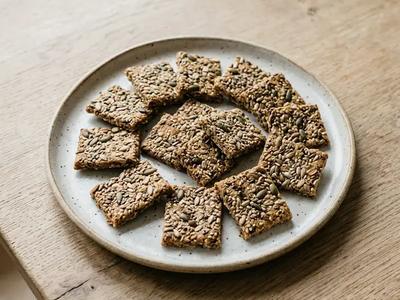
30 g of carbohydrate per 100 g, 25 g of it fibre, and 36.5 g of fat.
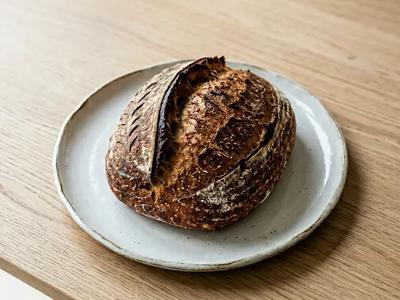
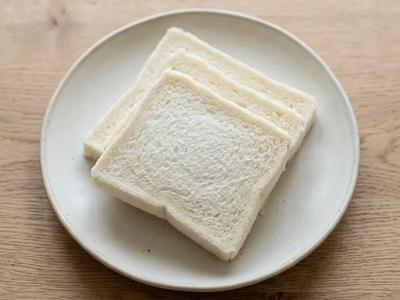
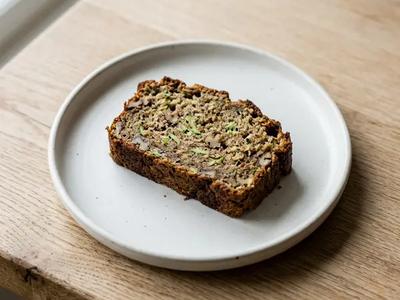
Here for the evidence note: 49.5 g of carbohydrate per 100 g, a gram under white bread.
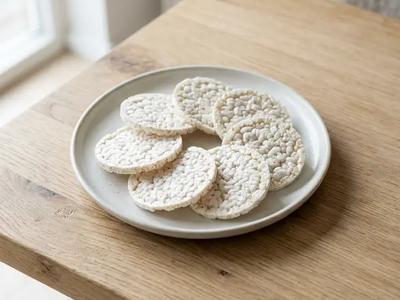
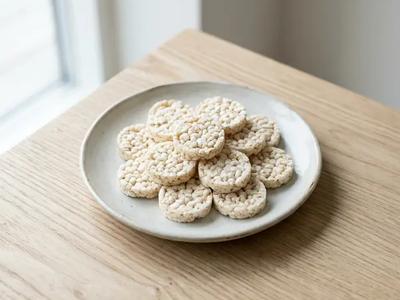
Here for the per-piece point: 82 g of carbohydrate per 100 g, but one cake weighs 9 g.
The loaves and crackers with the most fibre for their carbohydrate, the lightest flatbreads per piece, and sourdough and rice cakes for what their numbers teach. The whole wheat and rye loaves are featured in the Grains & Cereal guide.
USDA's reference weights put a slice of white bread at 25 to 30 g, a slice of wholemeal at 32 g, a plain bagel at 99 g, a 6-inch corn tortilla at 26 g and a plain naan at 90 g. At this library's figures, a slice of white bread is 13 to 15 g of carbohydrate, a bagel about 52 g, a naan about 50 g and a corn tortilla about 12 g: a bagel is nearer four slices than one. The NHS adds that the manufacturer's idea of a portion may differ from yours.[1] [2]
In the UK, bread may be called wholemeal only if all of the flour in it is wholemeal, under the Bread and Flour Regulations. They say nothing about brown, multigrain, granary or seeded, so those words describe the look or the recipe, not the flour. The NHS counts wholemeal, granary, brown and seeded loaves as healthy choices and suggests higher-fibre white bread for those who prefer white. The fibre line settles it: whole wheat and multigrain loaves here carry about 7 g per 100 g, white bread 2.4 g, and a brown loaf can sit anywhere between.[3] [4]
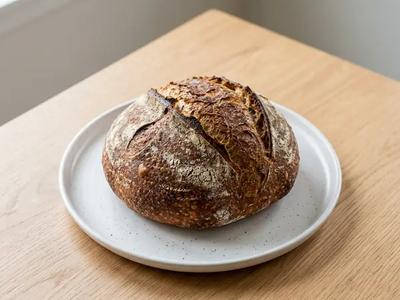
Diabetes UK's GI lists, written for diabetes in general, put rye bread among low-GI foods and white bread, some types of wholemeal bread and bagels among high-GI ones. Sourdough isn't on its lists. The two sourdough loaves here carry 49.5 g of carbohydrate per 100 g against 50.6 g for white bread, and USDA's French-style bread entry, which includes sourdough, 51.9 g. Fermentation doesn't remove the carbohydrate, and Diabetes UK's caution that portion size can matter more than GI applies here too.[1] [5]
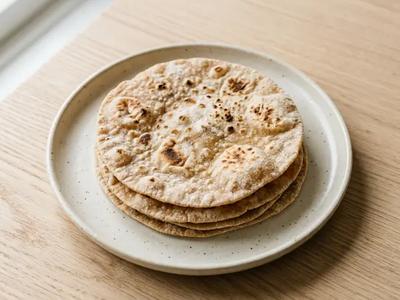
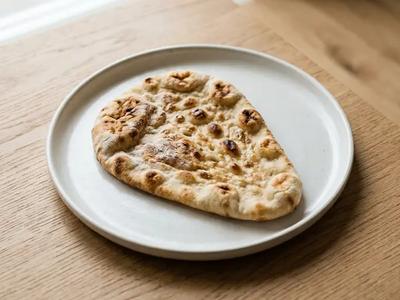
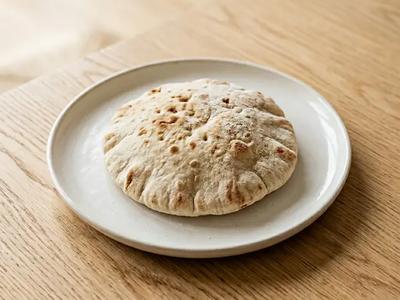
Pitta, naan, lavash and plain flatbread carry 55 to 56 g of carbohydrate per 100 g here, more than sliced bread's 45 to 51 g, and Diabetes UK files chapatti as medium GI. The piece weight decides the rest: USDA's large pitta at 60 g is about 33 g of carbohydrate, a 6-inch flour tortilla at 32 g about 16 g, and a 10-inch wrap at 72 g about 37 g.[1] [5]
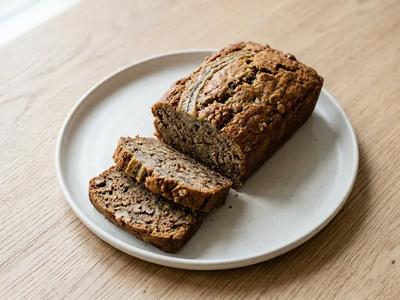
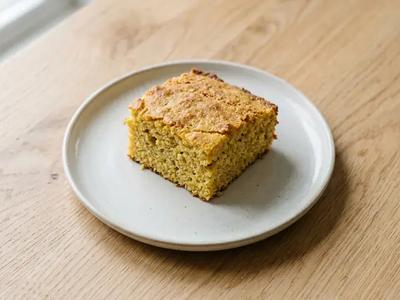
Croissants, brioche, scones and muffins carry about the same carbohydrate per 100 g as bread, 40 to 46 g. What changes is fat: USDA lists a butter croissant at 21 g per 100 g, 11.7 g of it saturated, where the NHS's label thresholds call more than 17.5 g of fat and 5 g of saturated fat high. The sweet bakes here are low-sugar versions, so none crosses the NHS's 22.5 g sugar line, but banana bread still carries 12.5 g of sugar per 100 g.[1] [2]
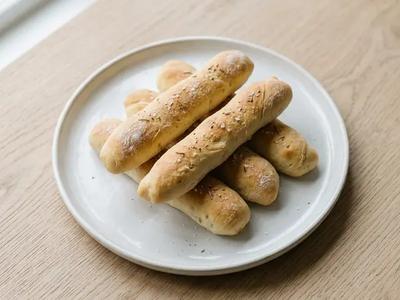
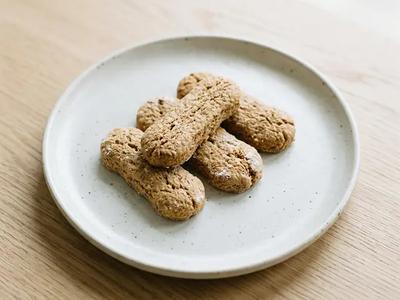
The NHS says about three quarters of the salt we eat comes from everyday packaged foods such as bread and breakfast cereals, and sets the adult limit at 6 g a day. Its high-salt threshold is 1.5 g per 100 g, which is 600 mg of sodium. Soft biscuits at 650 mg and breadsticks at 610 mg cross it here; rye bread, pitta and traditional sourdough sit at 510 to 533 mg. USDA's standard white bread lists 490 mg, so the low-sodium loaves here, at 100 to 150 mg, are the exception.[1] [2] [6]
| Food | Carbs | Fiber | Sugars | Blood sugar impact |
|---|---|---|---|---|
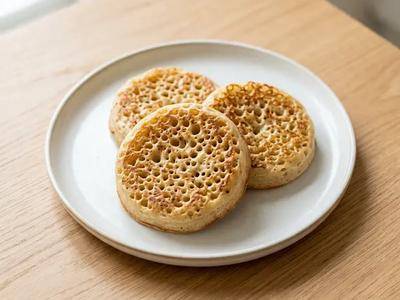
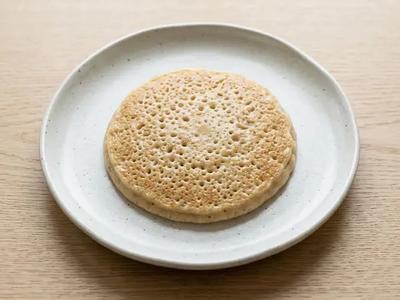
| Crumpets (plain, low sodium) | 38.2 g | 2.5 g | 2.1 g | high |
| Brioche (low sugar) | 45 g | 2.5 g | 5 g | high |
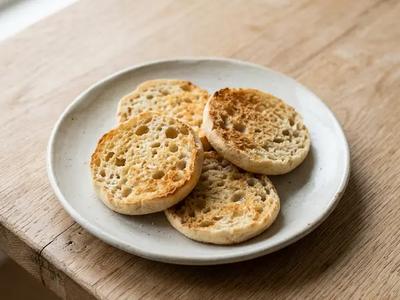
| English Muffins (Plain, Low Sodium) | 46 g | 4.1 g | 3.2 g | high |
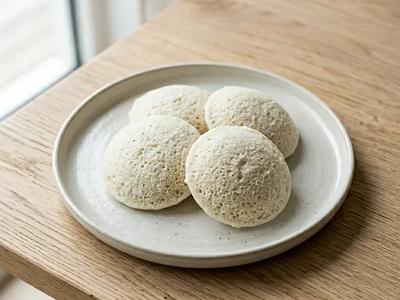
| Mantou (Chinese steamed bun) | 52 g | 1.5 g | 4 g | high |
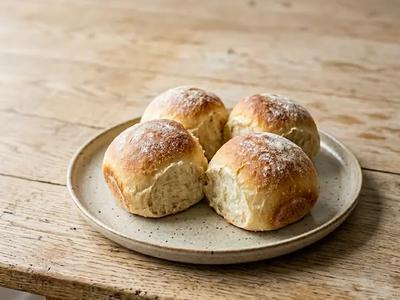
| Soft Bread Rolls | 52.3 g | 2.5 g | 5.2 g | high |
| Bagels (soft, plain, no toppings) | 52.5 g | 2.5 g | 5.2 g | high |
Crumpets carry the least carbohydrate per 100 g; bagels and soft rolls the most.
| Food | Carbs | Fiber | Sodium | Blood sugar impact |
|---|---|---|---|---|
| Injera (Ethiopian flatbread) | 20 g | 2.9 g | 5 mg | low |
| Soft Corn Tortilla | 45 g | 5.8 g | 46 mg | medium |
| Tortilla (whole wheat or corn, soft) | 52 g | 8 g | 450 mg | medium |
| Naan (plain, low sodium) | 55 g | 3 g | 200 mg | high |
| Soft pita bread | 55.7 g | 2.6 g | 533 mg | high |
| Chapati | 59 g | 11 g | 290 mg | medium |
Injera is listed wet at 20 g; the wheat flatbreads run from 52 to 59 g.
| Food | Carbs | Sugars | Fat | Blood sugar impact |
|---|---|---|---|---|
| Banana Bread (Low Sugar) | 35.2 g | 12.5 g | 9 g | medium |
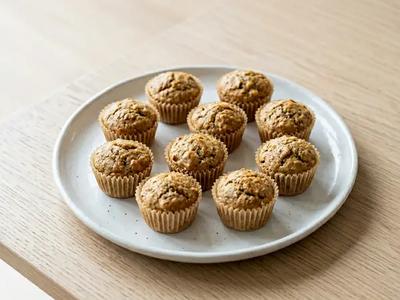
| Mini Muffins (Low Sugar) | 40.5 g | 10.8 g | 12 g | medium |
| Brioche (low sugar) | 45 g | 5 g | 15 g | high |
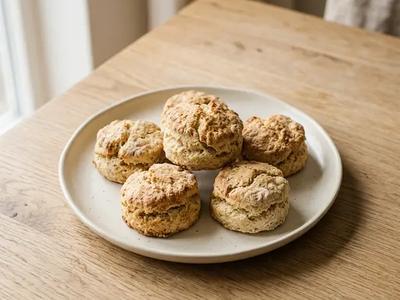
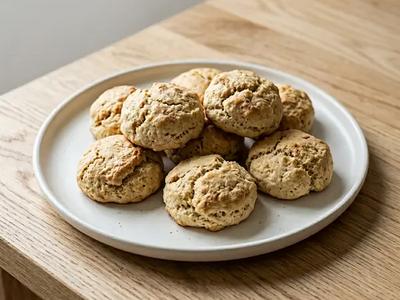
| Scones (low sugar, plain) | 45.5 g | 5.2 g | 12 g | high |
| Soft Croissants (Plain, No Filling) | 45.8 g | 5.5 g | 21 g | high |
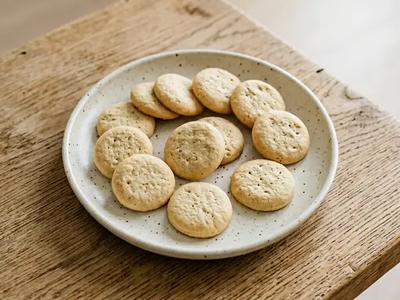
| Soft biscuits (unsweetened) | 45.8 g | 2.5 g | 16.7 g | high |
Carbohydrate stays between 35 and 46 g per 100 g; fat runs from 9 g to 21 g.
| Food | Carbs | Fiber | Fat | Blood sugar impact |
|---|---|---|---|---|
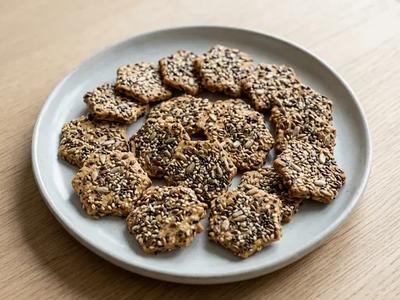
| Flaxseed Crackers | 30.1 g | 25.2 g | 36.5 g | low |
| High-Protein Crackers | 45.5 g | 10.2 g | 18 g | low |
| Seeded Crackers (Low-sodium) | 55.3 g | 10.2 g | 22.5 g | medium |
| Whole Grain Oatcakes | 61.3 g | 9.2 g | 17.8 g | medium |
| Soft Crackers (Low Sodium, No Sharp Edges) | 74.2 g | 3.1 g | 9 g | high |
| Rice cakes (unsalted, thin) | 82.1 g | 3.5 g | 3.1 g | high |
Rice cakes carry the most carbohydrate and almost no fat; seed crackers swap carbohydrate for fibre and fat.
Figures from each food's entry in this library. Open a food for its full profile and portion notes.
53 foods in this category, each rated for glycemic impact and blood sugar effect.
Track how bread and baked goods affects your blood sugar with the SugarCurve app — free to download.
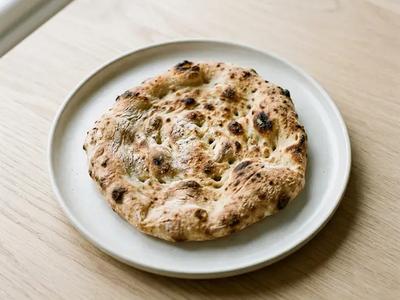
Start Free Trial →It carries the same carbohydrate as white bread: 49.5 g per 100 g here against 50.6 g. Diabetes UK's GI lists name rye bread as low GI and white bread and bagels as high, and don't mention sourdough. If you like it, count it by the slice like any other bread and see what your own readings do.[5]
Usually not. USDA weighs a 10-inch flour tortilla at 72 g, about 37 g of carbohydrate at this library's figures, the same as two and a half slices of white bread. A 6-inch tortilla, at 32 g, is about 16 g, close to one slice.[1]
Per 100 g they carry 82 g of carbohydrate, the most in this category, but USDA weighs a rice cake at 9 g, so one cake is about 7 g. Diabetes UK notes that portion size can matter more than GI; what goes on top usually decides the rest.[1] [5]
Mostly eggs, nuts, seeds or coconut in place of flour. Cloud bread here carries 2.5 g of carbohydrate per 100 g but 15 g of fat; almond-flour tortillas 20 g of carbohydrate, half of it fibre, with 27 g of fat. Eggs, tree nuts and sesame are regulated allergens on the FSA's list, so read the ingredients if you're buying for someone else.[7] [8]
Every pregnancy is different, and gestational diabetes is managed differently depending on your readings, your medication and how far along you are. The ratings and portions on this page are general information — not a diagnosis, a treatment plan or a medical device — and they cannot see your results.
Contact your care team the same day if: your readings stay above target for several days; you have a reading below 54 mg/dL (3.0 mmol/L) or needed someone else's help to treat a low; you test positive for ketones; or your baby is moving less than usual. Seek emergency care for confusion, fainting, repeated vomiting, or a low you cannot bring back up.
By using this guide, you agree to our Terms and Conditions. How we write, source and review this content: editorial policy.
Compiled and reviewed by Dalo Labs ApS. Numbered references in the text point to the sources below. Not endorsed by or affiliated with any referenced organization. · Last reviewed: August 30, 2026
SugarCurve plans your week, turns cravings into recipes and shows how your readings respond to what you eat, so following your care team's advice takes less guesswork, day after day.
7 days free, then a subscription. Cancel anytime before the trial ends.