Food Library
Bread, rice, pasta, oats and breakfast cereals are mostly carbohydrate. In this library the figures run from under 20 g per 100 g for some cooked grains to more than 80 g for puffed rice and several flours, depending on the food and on whether it is listed cooked or dry. So the useful questions are practical: how much carbohydrate is in your portion, how much fibre comes with it, and what the label is telling you. This guide works through those, then covers two food-safety habits that are specific to grains: cooling cooked rice quickly and not eating raw flour or dough. Whole grains, breads and flours each have a page of their own, and every food is listed further down.
See what works for you. Try SugarCurve free for 7 days
154 foodsLast reviewed: September 11, 2026Sources

No foods found for your search.
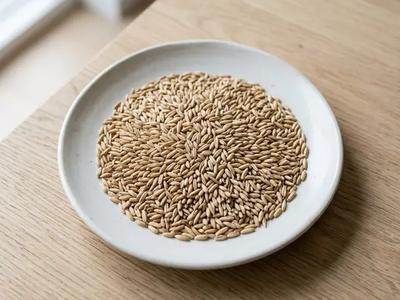
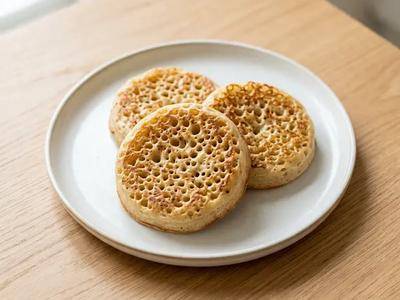
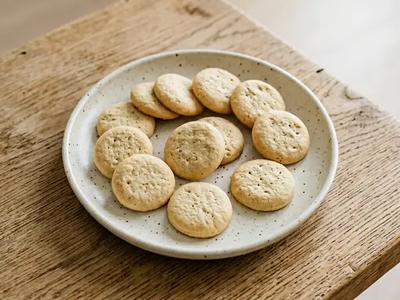
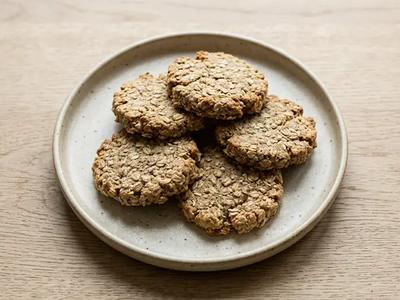
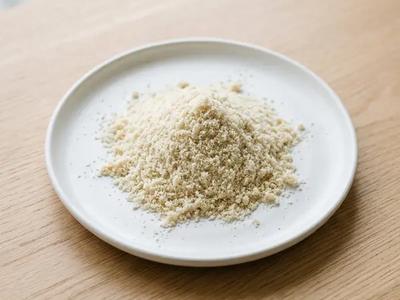
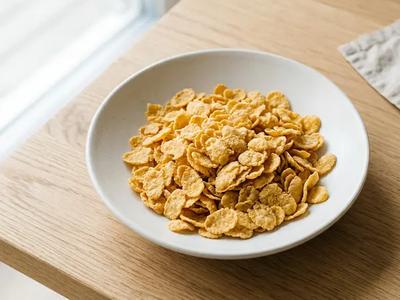
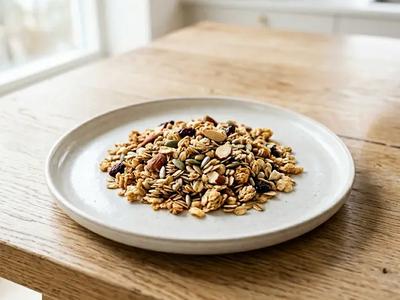
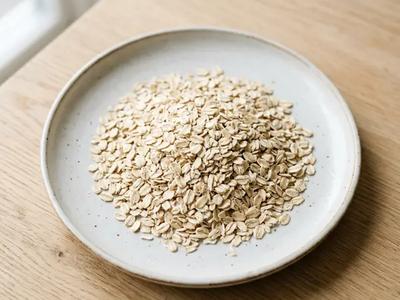
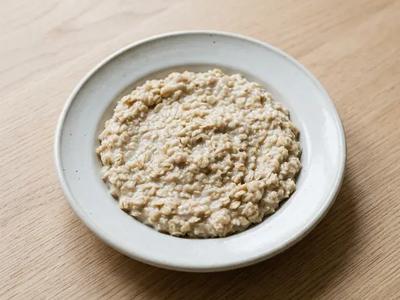
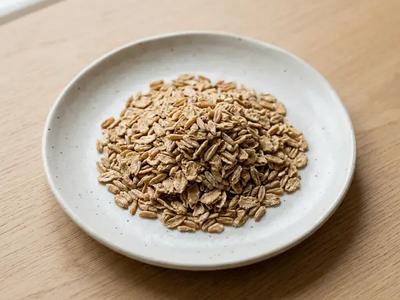
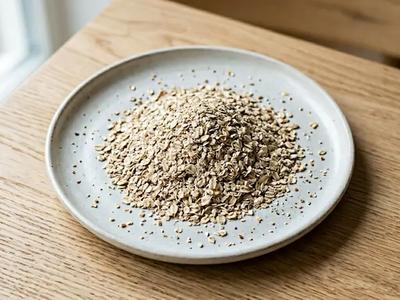
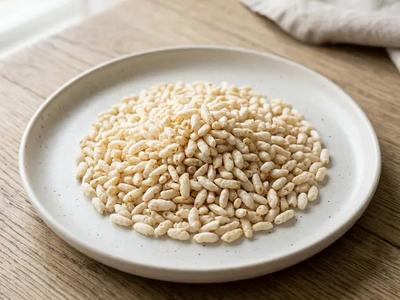
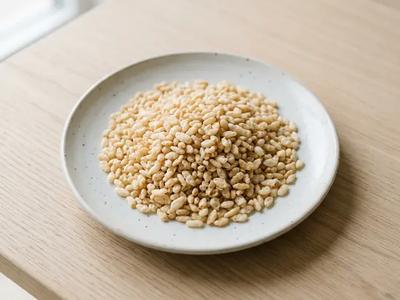
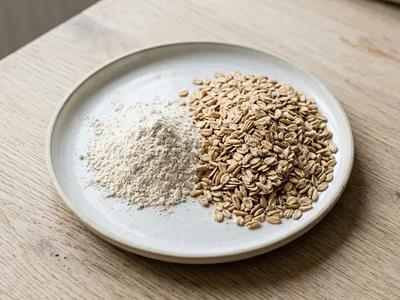
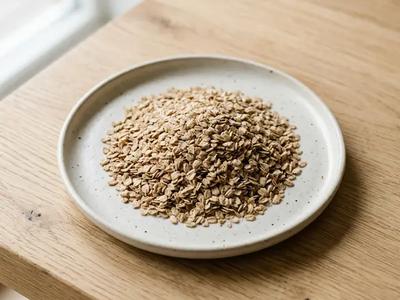
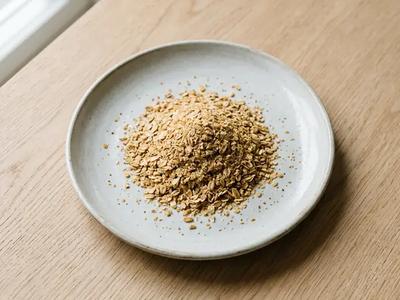
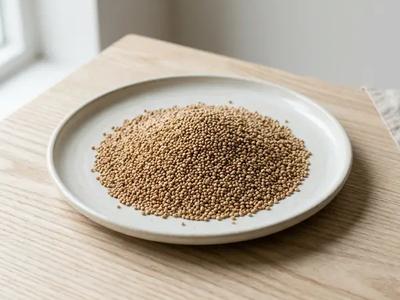
The breakfast benchmark: about 1 g of sugar per 100 g dry, against about 25 g for granola.
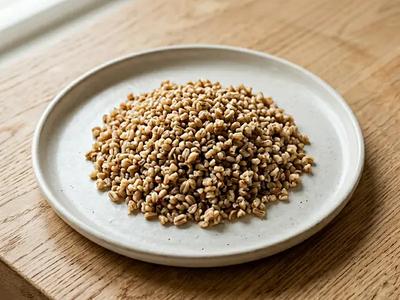
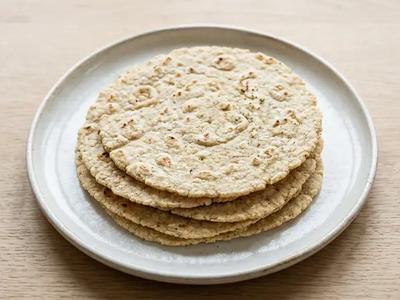
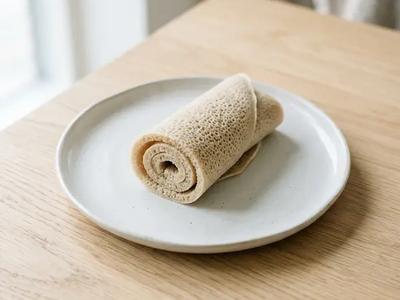
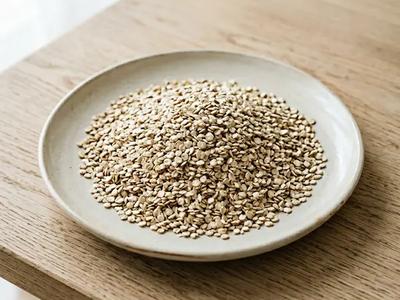
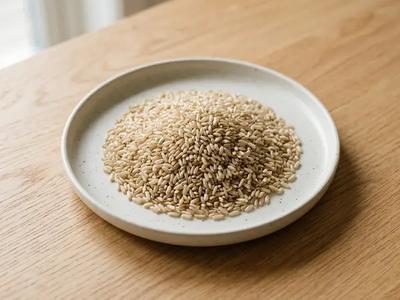
The lowest-carbohydrate cooked grain in the comparison, with the most fibre.
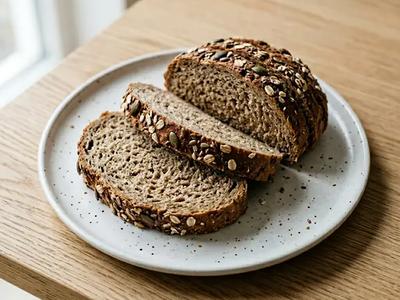
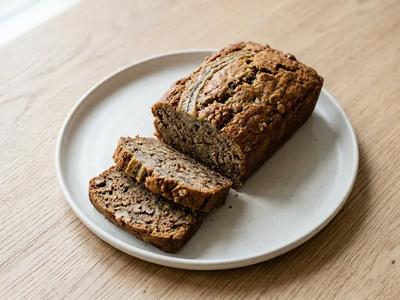
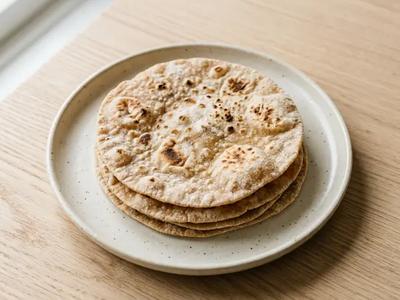
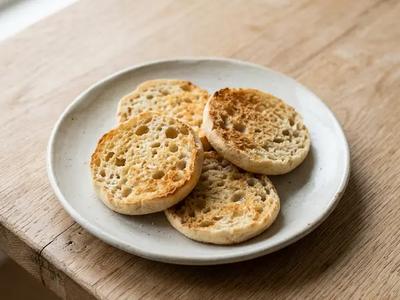
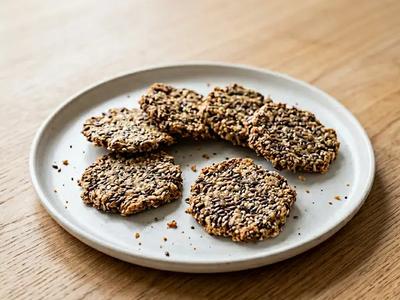
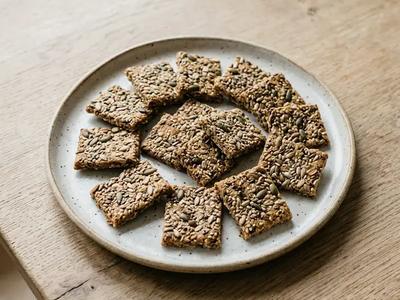
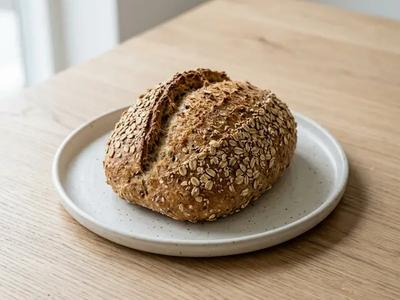
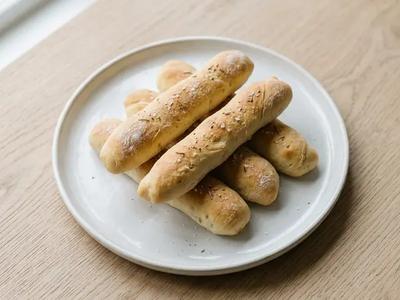
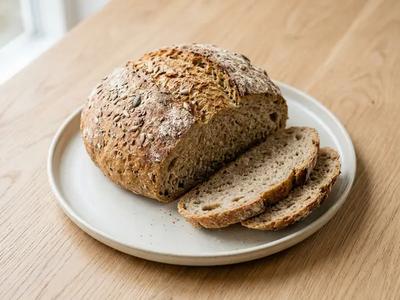
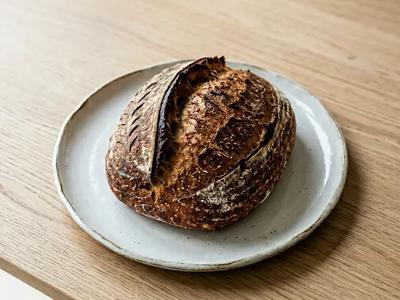
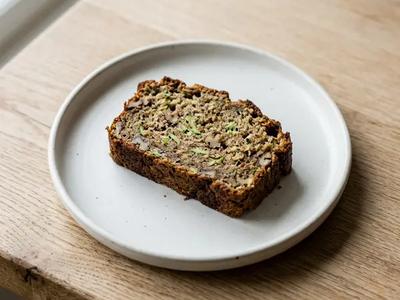
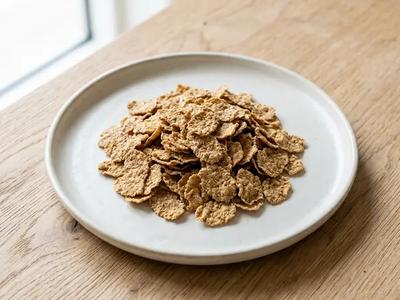
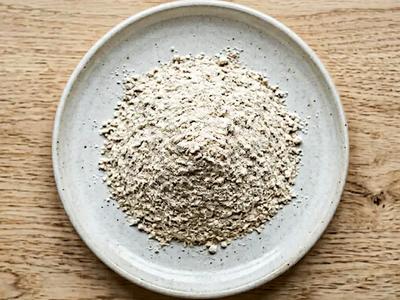
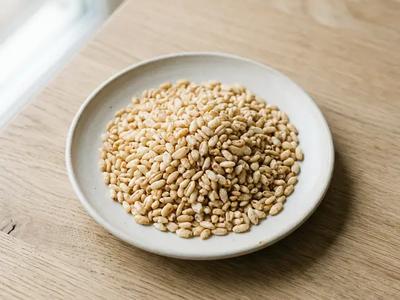
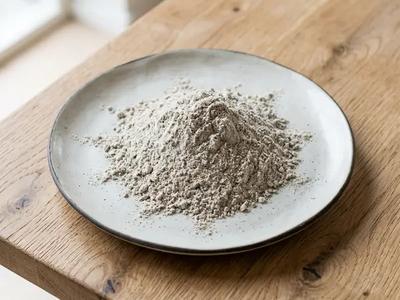
About 7 g of fibre per 100 g, nearly three times white bread's.
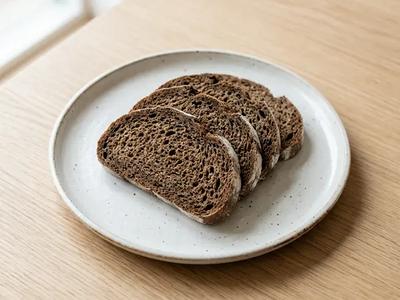
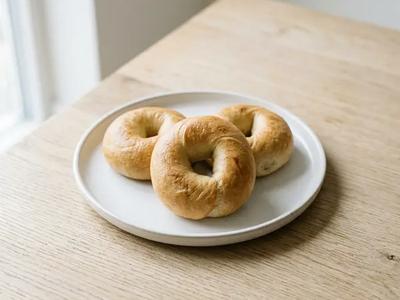
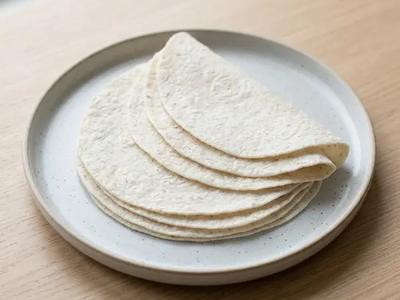
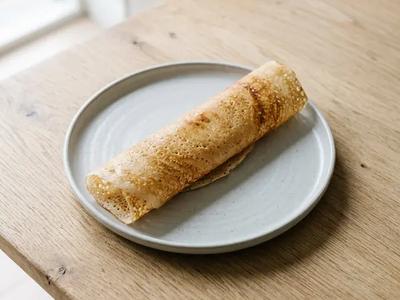
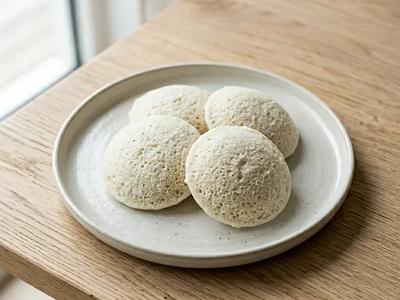
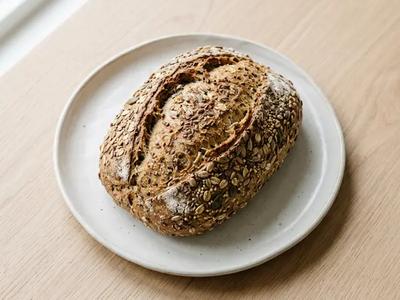
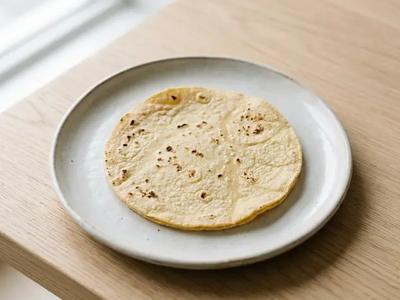
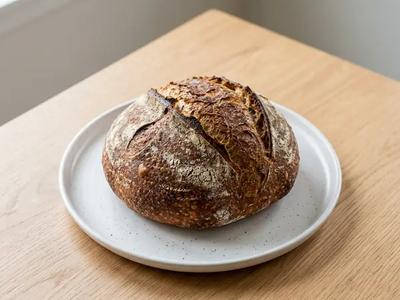
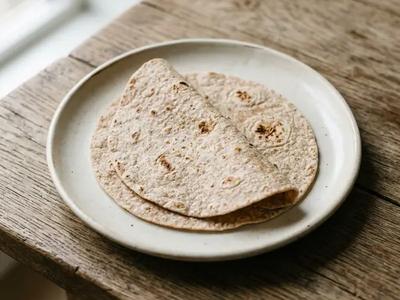
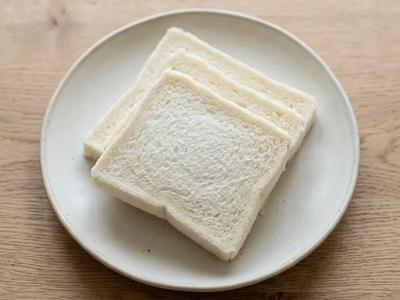
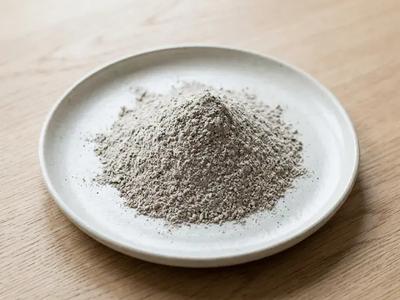
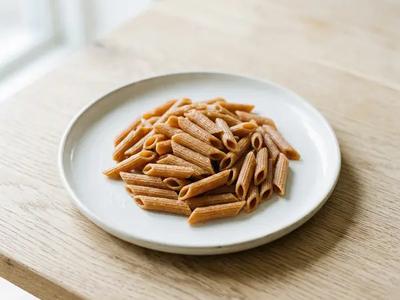
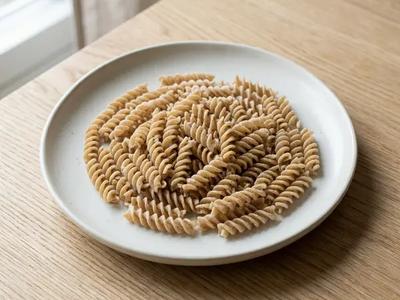
About 6 g of fibre per 100 g, and a little less carbohydrate than white bread.
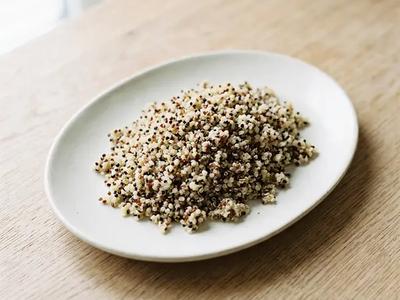
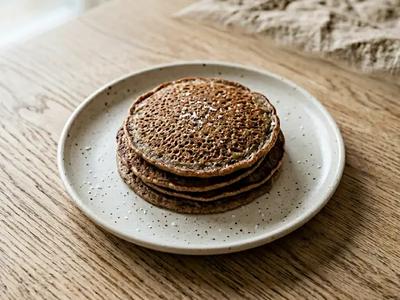
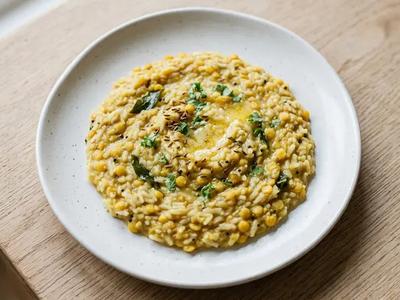
Listed cooked, at about 21 g of carbohydrate per 100 g, with more protein than brown rice.
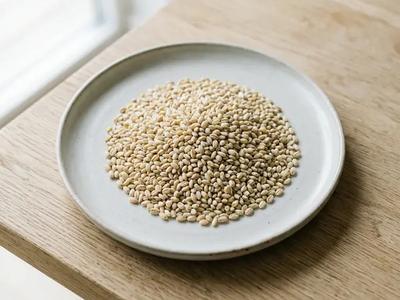
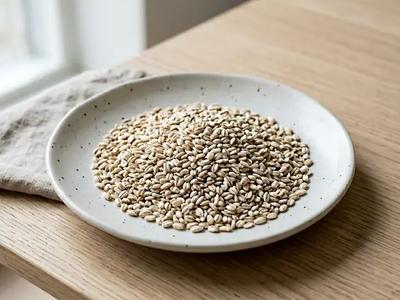
Cooked barley: about 28 g of carbohydrate per 100 g, with close to 4 g of fibre.
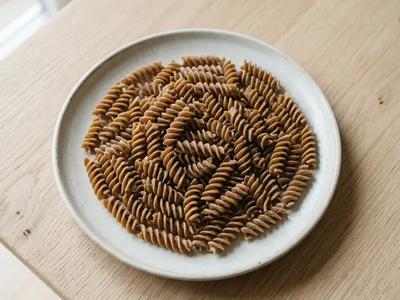
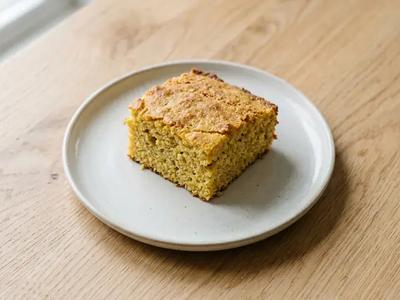
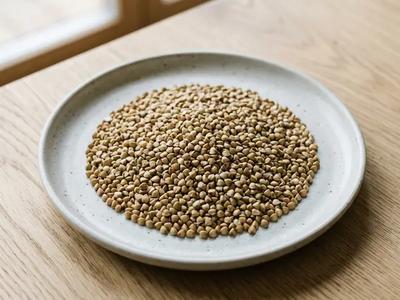
Listed cooked, at about 27 g of carbohydrate and nearly 4 g of fibre per 100 g.
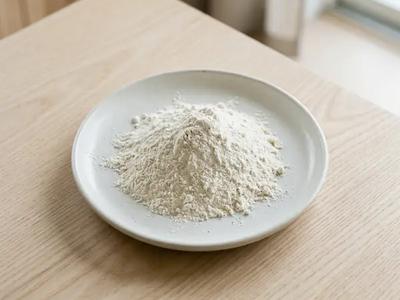
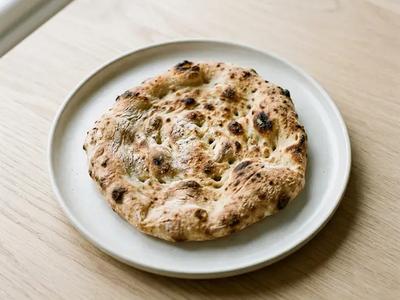
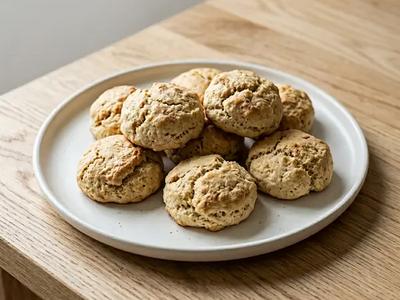
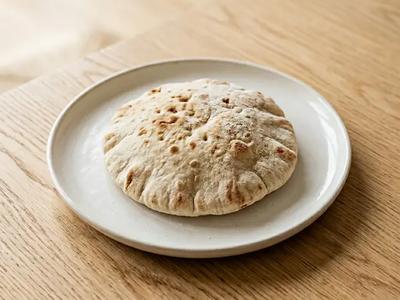
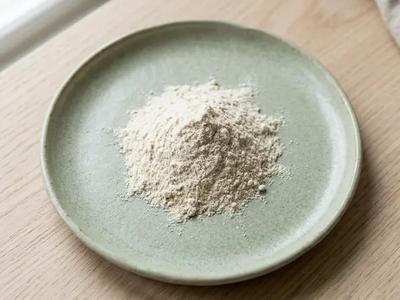
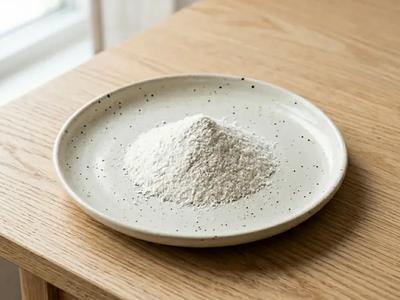
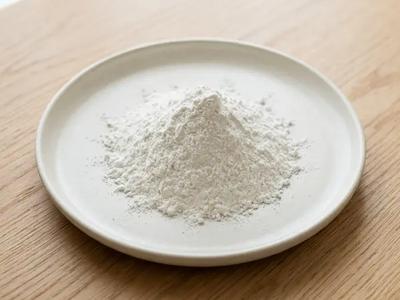
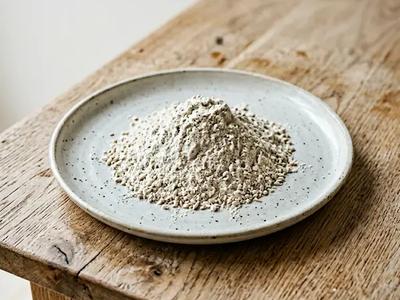
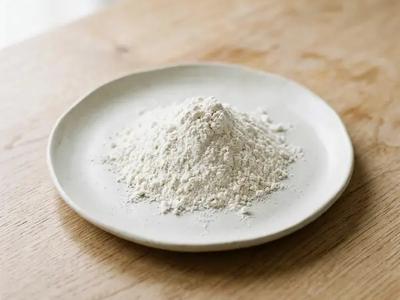
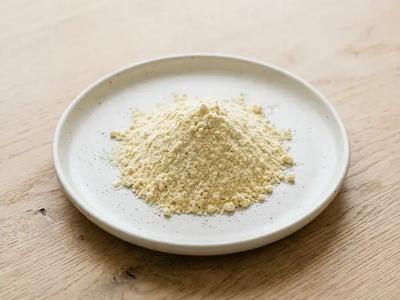
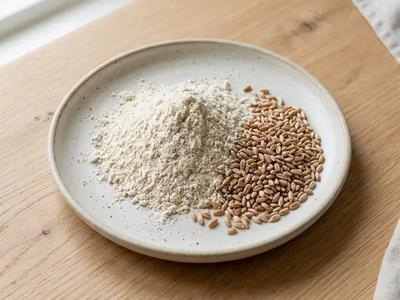
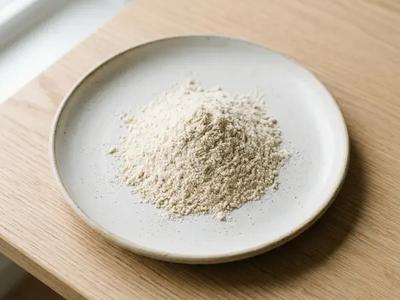
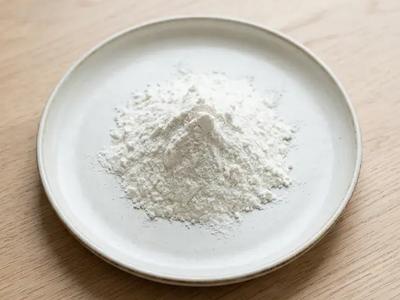
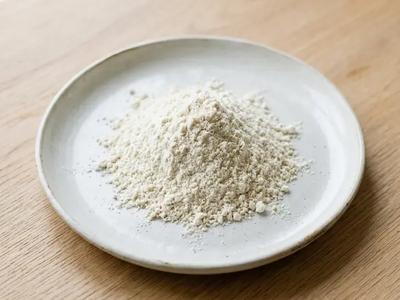
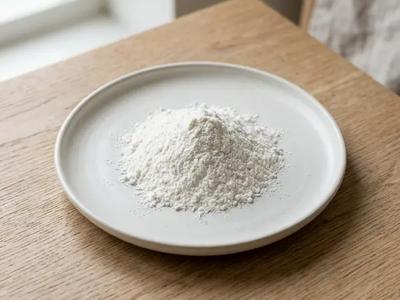
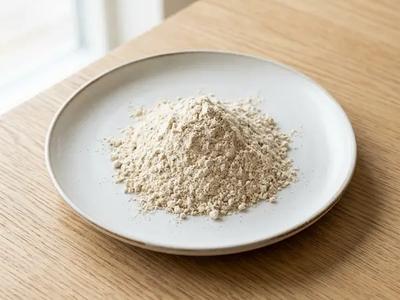
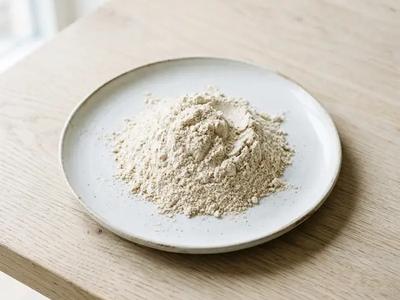
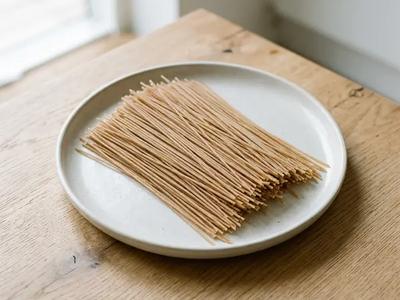
Here for its food-safety note: flour is a raw ingredient, so cook dough and batter before tasting.
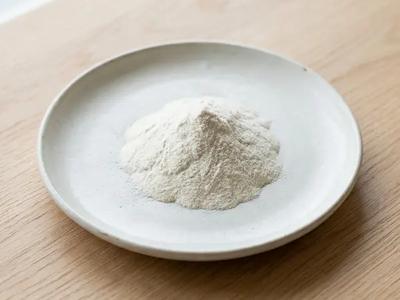
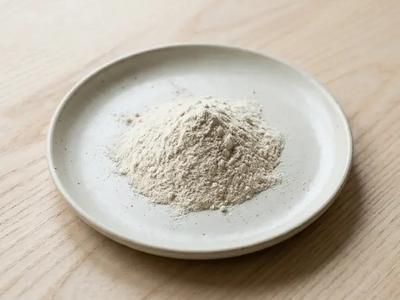
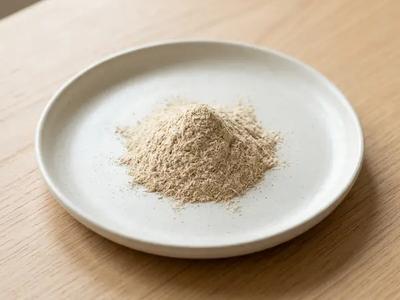
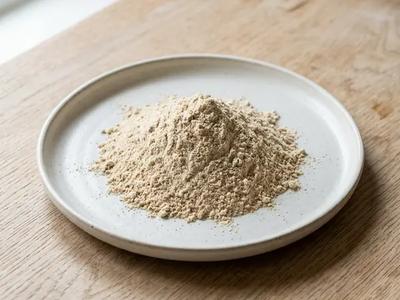
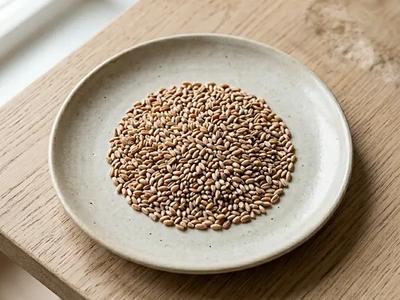
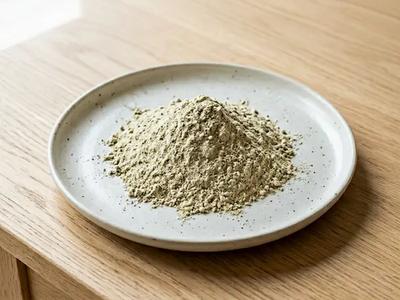
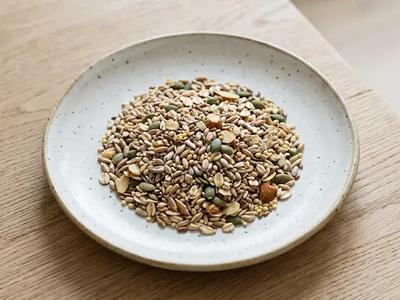
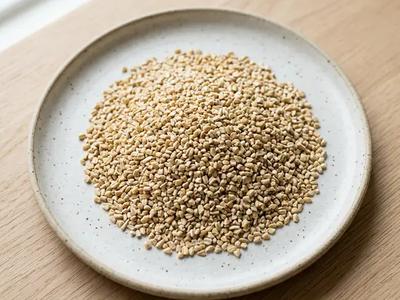
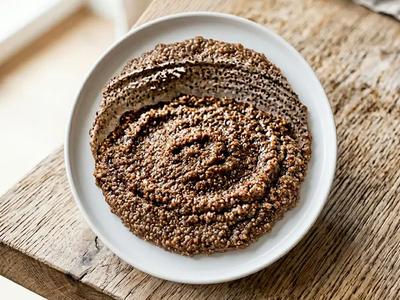
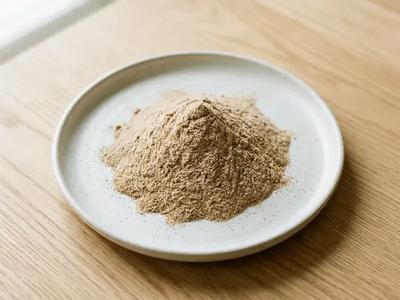
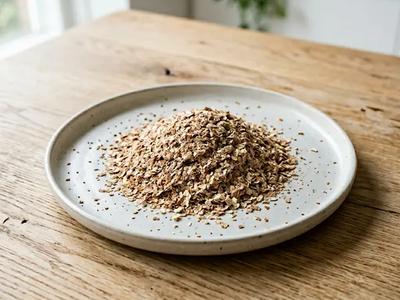
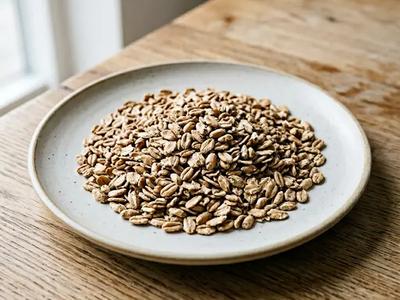
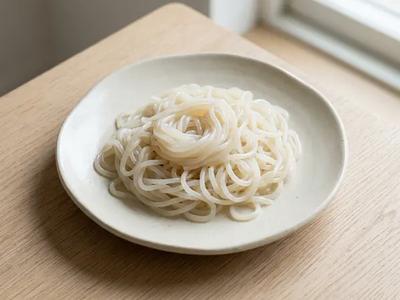
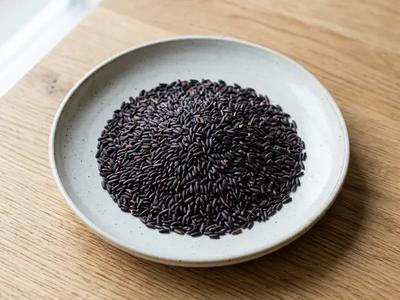
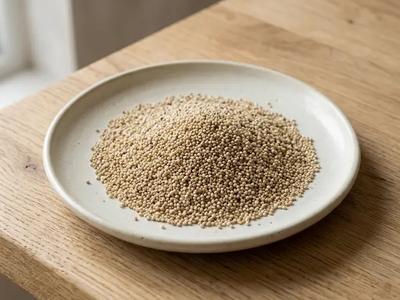
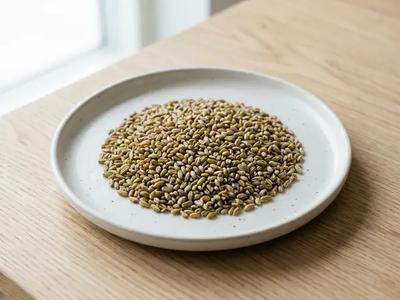
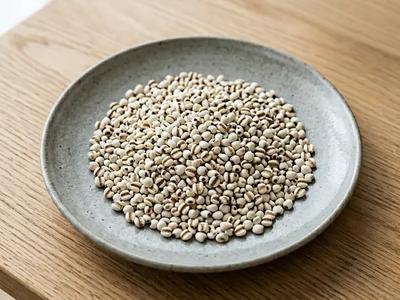
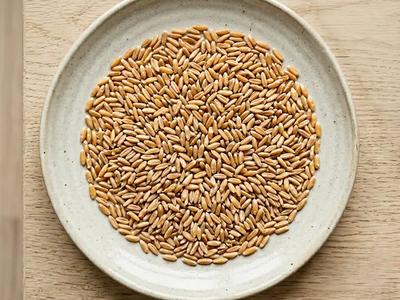
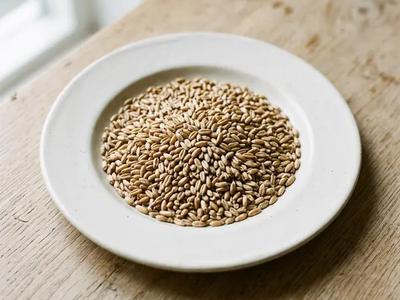
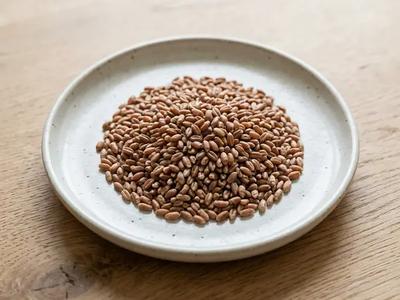
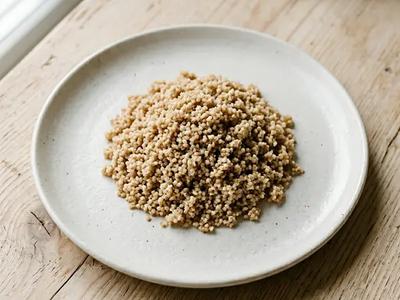
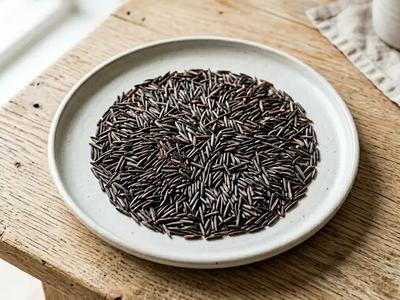
The breads and grains with the most fibre for their carbohydrate, plain oats as the breakfast benchmark, and plain flour for its safety note. Slippery elm powder and Job's tears are marked avoid here, so neither is featured.
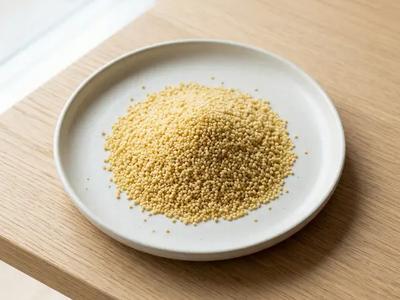
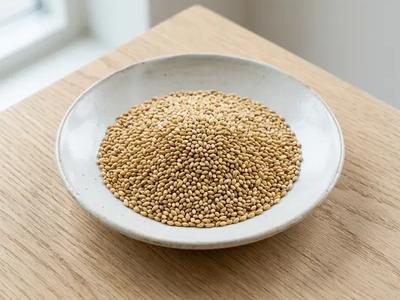
Grains take up water as they cook, so the same grain carries a very different figure per 100 g depending on its state. USDA lists uncooked quinoa at about 64 g of carbohydrate per 100 g and cooked quinoa at 21 g; white rice goes from about 80 g to 28 g, and dry pasta from 75 g to 31 g. This library mixes the two. Quinoa, brown rice, bulgur and most other whole grains are listed cooked, while oats, millet, teff, flours and breakfast cereals are listed dry. Weigh a portion in the same state as the figure you use.[1]
The NHS notes that white bread has less fibre than wholegrain, wholemeal or brown bread, and suggests wholewheat pasta, bulgur wheat and brown rice as ways to eat more fibre, towards its guideline of 30 g a day for adults. The carbohydrate moves far less than the fibre does: USDA puts cooked brown rice at about 26 g per 100 g against 28 g for white, with 1.6 g of fibre against 0.4 g. The bread comparison below shows the same pattern.[1] [2] [3]
Diabetes UK explains that a food's GI can change with how it is cooked and processed, and that protein, fat and fibre slow the digestion of carbohydrate. It adds that GI takes no account of portion size, and that the amount of carbohydrate has a bigger effect on blood sugar than GI alone. Its lower-GI swaps include brown or basmati rice for white, and granary, pumpernickel or rye bread. That advice is written for diabetes generally rather than for pregnancy.[4]
The NHS notes that many breakfast cereals are refined and can be high in added sugar and salt, and suggests checking the label. On a UK label, more than 22.5 g of total sugars per 100 g counts as high, and 5 g or less as low. In this library, plain oats carry about 1 g of sugar per 100 g, while granola carries about 25 g, and bran flakes and muesli 18 to 20 g, despite their fibre.[2] [5]
Under EU rules, 'source of fibre' means at least 3 g of fibre per 100 g, 'high fibre' at least 6 g and 'low sugars' no more than 5 g. They are thresholds, not rankings, so compare the nutrition panels.[6]
Because spores in rice can survive cooking, the NHS advises serving rice and grains as soon as they are cooked, or cooling them within an hour and keeping them in the fridge, and reheating rice only once, to 70°C for 2 minutes. The FDA treats flour as a raw food that can carry salmonella and E. coli, and advises never eating or tasting raw flour, dough or batter.[2] [7]
| Food | Carbs | Fiber | Protein | Blood sugar impact |
|---|---|---|---|---|
| White Bread (Soft, Crust Removed) | 50.6 g | 2.4 g | 9.4 g | high |
| Sourdough Bread (low sodium) | 49.5 g | 3.2 g | 9.1 g | medium |
| Rye Bread (without seeds) | 48.3 g | 6 g | 8.5 g | medium |
| Whole Wheat Bread (Low Sodium) | 45 g | 7 g | 13 g | medium |
| Multigrain Bread (low sodium) | 45.5 g | 7.2 g | 10.1 g | medium |
| Spelt Bread (low sodium) | 48 g | 8 g | 11 g | medium |
The carbohydrate stays within about 6 g per 100 g across these loaves; the fibre runs from about 2 g to 8 g.
| Food | Carbs | Fiber | Protein | Blood sugar impact |
|---|---|---|---|---|
| Bulgur | 18.6 g | 4.5 g | 3.1 g | low |
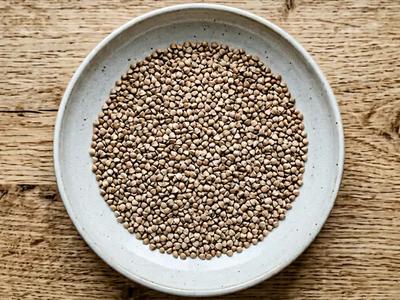
| Buckwheat | 19.9 g | 2.7 g | 3.4 g | low |
| Quinoa | 21.3 g | 2.8 g | 4.4 g | low |
| Brown Rice | 25.6 g | 1.6 g | 2.7 g | medium |
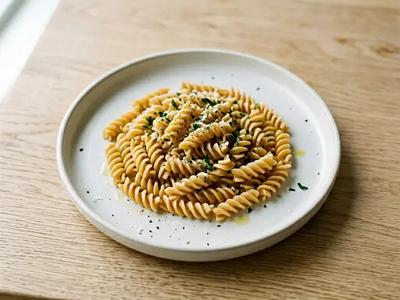
| Whole Grain Pasta | 26.5 g | 3.7 g | 5.3 g | low |
| Barley Groats | 28.2 g | 3.8 g | 2.3 g | low |
All figures are for the cooked grain. Bulgur carries the least carbohydrate and the most fibre of these.
| Food | Carbs | Sugars | Fiber | Blood sugar impact |
|---|---|---|---|---|
| Oats | 66.3 g | 1.1 g | 10.6 g | low |
| Wheat Flakes | 70.1 g | 0.8 g | 12.5 g | medium |
| Cornflakes | 84.1 g | 9.1 g | 2.9 g | high |
| Muesli | 60.5 g | 18.4 g | 9.2 g | medium |
| Bran flakes | 75.5 g | 19.8 g | 15.1 g | high |
| Granola | 60.5 g | 25.3 g | 9.2 g | high |
All figures are dry. Plain oats and wheat flakes carry about 1 g of sugar per 100 g; granola carries the most.
| Food | Carbs | Fiber | Protein | Blood sugar impact |
|---|---|---|---|---|
| All-purpose flour | 76.3 g | 2.7 g | 10.3 g | high |
| Rye Flour | 75.9 g | 22.6 g | 15 g | low |
| Oat Flour | 68.2 g | 10.1 g | 14.7 g | medium |
| Chickpea Flour | 57.8 g | 10.8 g | 22.4 g | low |
| Almond Flour | 21.6 g | 12.5 g | 21.2 g | low |
| Coconut Flour | 59.3 g | 38.5 g | 19.3 g | low |
Nut and legume flours carry less carbohydrate and more protein than grain flours.
Figures from each food's entry in this library. Open a food for its full profile and portion notes.
154 foods in this category, each rated for glycemic impact and blood sugar effect.
Track how grains & cereal affects your blood sugar with the SugarCurve app — free to download.
Start Free Trial →Yes. The loaves compared above carry about 45 to 51 g of carbohydrate per 100 g, and Diabetes UK notes that the amount of carbohydrate affects blood sugar more than GI does. The NHS points to wholegrain, wholemeal and brown bread for their fibre. Your dietitian or diabetes team can say how much fits your plan.[2] [4]
Only slightly. USDA lists cooked brown rice at about 26 g of carbohydrate per 100 g and cooked white rice at 28 g. The bigger difference is fibre, 1.6 g against 0.4 g. Diabetes UK lists brown and basmati rice among its lower-GI swaps for white rice, while noting that the amount on the plate matters more.[1] [4]
Either, as long as the figure you use is for the same state. By USDA's figures, dry pasta carries about 75 g of carbohydrate per 100 g and cooked pasta about 31 g, so using the dry figure for a cooked portion would count more than twice the carbohydrate actually on the plate.[1]
Yes, if it was handled the way the NHS advises for everyone: cooled within an hour of cooking, kept in the fridge, and reheated only once, until it reaches 70°C for 2 minutes. The risk is rice left at room temperature, where spores that survive cooking can produce toxins.[2]
The FDA's advice on arsenic in food is to eat a variety of foods across and within the food groups, grains included, rather than rely on any one of them. It notes that cooking rice in plenty of water lowers its arsenic, though it also washes out the vitamins added to enriched rice.[8]
Every pregnancy is different, and gestational diabetes is managed differently depending on your readings, your medication and how far along you are. The ratings and portions on this page are general information — not a diagnosis, a treatment plan or a medical device — and they cannot see your results.
Contact your care team the same day if: your readings stay above target for several days; you have a reading below 54 mg/dL (3.0 mmol/L) or needed someone else's help to treat a low; you test positive for ketones; or your baby is moving less than usual. Seek emergency care for confusion, fainting, repeated vomiting, or a low you cannot bring back up.
By using this guide, you agree to our Terms and Conditions. How we write, source and review this content: editorial policy.
Compiled and reviewed by Dalo Labs ApS. Numbered references in the text point to the sources below. Not endorsed by or affiliated with any referenced organization. · Last reviewed: September 11, 2026
SugarCurve plans your week, turns cravings into recipes and shows how your readings respond to what you eat, so following your care team's advice takes less guesswork, day after day.
7 days free, then a subscription. Cancel anytime before the trial ends.